ECG Signal Processing for Cerebromicrovascular Disease Analysis
Overview
This project focused on the processing and analysis of electrocardiogram (ECG) signals acquired from elderly diabetic patients with cerebral microvascular disease. Diabetes-related cardiovascular and cerebrovascular pathology introduces characteristic abnormalities in ECG signals, motivating the development of automated methods for robust heartbeat detection, waveform feature extraction and quantitative classification.
Over the final quarter of the semester, a complete ECG signal processing pipeline was implemented to detect cardiac events, identify PQRST waveform features and evaluate classification performance using machine learning techniques. Results were benchmarked against published literature.
Project Type: Academic Signal Processing Project
Duration: 1 month
Focus Areas: Biomedical Signal Processing · Feature Extraction · Machine Learning
Role: Signal processing, algorithm implementation, data analysis
Motivation
ECG analysis plays a critical role in assessing cardiovascular and cerebrovascular health, particularly in aging populations with metabolic disease. Automated detection of cardiac events and waveform features enables scalable analysis but remains sensitive to noise, signal variability and pathological conditions.
The objective of this project was to design and evaluate a robust ECG processing pipeline capable of reliable heartbeat detection, waveform feature extraction and quantitative classification in noisy clinical data.
Design Rationale
ECG signals are highly susceptible to noise from power-line interference, baseline wander and muscle activity; requiring careful preprocessing prior to analysis. The Pan–Tompkins algorithm was selected for heartbeat detection due to its robustness, interpretability and widespread use in clinical ECG analysis.
Time-domain features derived from PQRST waveforms—particularly RR, ST and QT intervals—were targeted due to their established relevance in assessing cardiac function and autonomic regulation. These features formed the basis for downstream machine learning classification between control and diabetic patient groups.
Signal Processing & Analysis Pipeline
ECG signals were obtained from the CVES database, consisting of recordings from elderly control and diabetic patients with cerebral microvascular disease. Signals were sampled at 1000 Hz over extended monitoring periods, with representative subsets selected for detailed analysis.
The processing pipeline consisted of:
- Removal of power-line interference using a notch filter
- Bandpass filtering and QRS detection using the Pan–Tompkins algorithm
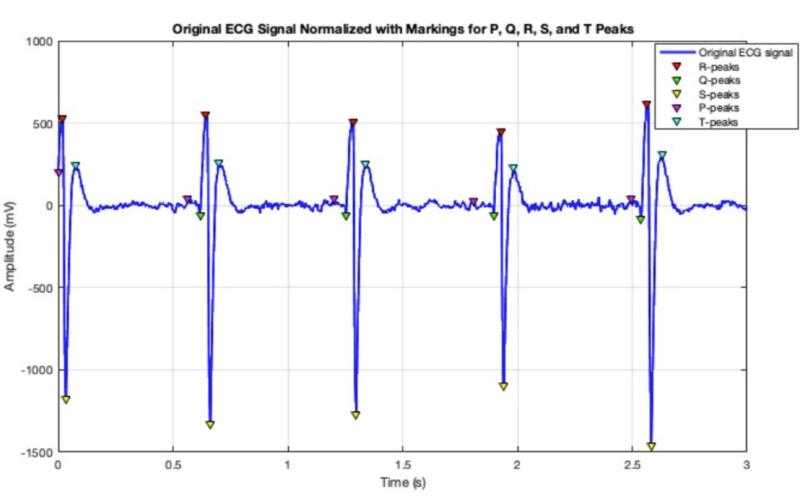
- Identification of PQRST waveform components
- Extraction of clinically relevant time-domain features
- Machine learning–based classification and performance evaluation
Signal processing and feature extraction were implemented in MATLAB, emphasizing algorithm transparency and reproducibility.
Feature Extraction & Machine Learning
Extracted features included heart rate variability (RR intervals), ST and QT interval statistics and associated mean and standard deviation measures. Feature selection prioritized parameters known to exhibit sensitivity to diabetic cardiovascular pathology.
Multiple machine learning models were evaluated, including Logistic Regression, Decision Tree and Linear Discriminant classifiers. Logistic regression demonstrated the most reliable performance and was selected for final evaluation due to its interpretability and consistent classification behaviour across the dataset.
Key Results
- 66.7% sensitivity in heartbeat event detection
- 62.3% validation accuracy using logistic regression classification
- Performance approximately 20% above reported literature benchmarks for comparable ECG datasets
Model evaluation was performed using 5-fold cross-validation due to the limited dataset size, with approximately 23% of the data held out for testing. Results demonstrated effective feature extraction and competitive classification performance despite signal variability and patient-specific differences.
Logistic regression was selected for final evaluation due to its interpretability and consistent performance across cross-validation folds.
ECG Visualization
Technical Documentation
Tools & Technologies
MATLAB · Pan–Tompkins Algorithm · ECG Interpretation
Signal Processing · Feature Extraction · Machine Learning
Biomedical Data Analysis
Limitations & Future Work
This study was conducted on a limited subset of ECG recordings, which constrained model generalizability and increased sensitivity to inter-subject variability. The relatively small dataset size necessitated the use of 5-fold cross-validation and likely contributed to modest classification performance and increased susceptibility to overfitting.
Future work would benefit from larger, more diverse ECG datasets to improve statistical power and model robustness. Incorporating additional features, alternative classifiers and temporal modeling approaches may further enhance performance. Extending the pipeline to multi-lead ECG data and longer-term rhythm analysis could also provide more comprehensive clinical insight.
Reflection
This project strengthened my ability to translate theoretical signal processing concepts into functional analytical pipelines for real biomedical data. It reinforced careful algorithm implementation, quantitative validation and clear technical communication—skills directly applicable to biomedical research, medical signal analysis and data-driven healthcare applications.